
Approvals Category
Approvals FAQ
Approvals Workflows
Auto rejecting of invoices issue
Coding approvals
Creating Approvals
Division Management
Flashing invoice approval icon
How to approve or reject
Leaver process – Approver
Mandatory Approval Comments
Supplier approvals
Workflows & Approvals (part 2)
Business Unit Category
Add an email signature
Audit Trail
Coding Lists
Coding Restrictions
Create new Business Unit
Custom Buttons
Custom Fields
Custom Fields on Line Items
Customised labels
Date formating
Default delivery address
Division Management
Editing Email Templates
GRN Custom Fields
How to hide cost codes
How Zahara works
Invoice email forwarding – Microsoft 365
Required by Date
Single Sign On
SMTP & Email Sending
T&C on your PO Template
Tax Codes Explained
Two factor authentication
Unit Field
Invoice Processing Help Category
Auto reject supplier invoices
Auto rejecting of invoices issue
Finding an order or invoice
How to create a credit note
Invoice email forwarding – Microsoft 365
Invoice export colours
Invoice Inbox
Invoice List View
Invoice matching
Invoice Processing Explained
Month end cut offs
Negative Order Balance
Setting up Autopilot
Supplier Matching
Waiting for a GRN
Purchase Orders Category
Adding a product to an order
Adding documents to an order
Bulk importing orders
Close Orders Automatically
Closing an order
Copy PO to Buyer
Creating a Purchase Order
Deleting a PO
Duplicate Order Prevention
Editing an order
Finding an order or invoice
GRN an order
Grouped Purchase Orders
Import Line Items
Negative Order Balance
PO Template Editing
Purchase Order Numbering
Purchase Order PDF
Purchase Order Prefix
Purchase Orders Explained
Quick Create a Purchase Order
Second Ref Counter
Send PO to Supplier
Supplier order acceptance
You can connect to your Zahara data in a spreadsheet or your favourite BI tool like PowerBI. The data is updated daily, around 4am GMT, and allows you to create reports or pivots of your data saving you from logging into Zahara and running off reports. You can access your Zahara data in the reporting API. This might sound daunting but it’s actually very straight forward and Excel makes it relatively easy to access your data, transform it in anyway you choose and then use it easily from that point onwards.
The link below will take you to the API page where you can see all of the fields that are made available. The data guys will know this as a swagger file:
https://data-api.myzahara.net/swagger/index.html
The data made available to you is:
To use the data api, you need Zahara to enable your tenancy. You can discuss this with customer success or sales, as the functionality is premium and chargeable based on how many line items you have stored. The starting price is £40 per month for 6000 line items. Once enabled your data will be made available and updated once a day. There are two variables you need.
Even with these two pieces of information, the data will not appear until we have enabled your tenancy and the overnight process has run.
The data is updated daily so is designed for reporting where real-time data isn’t required.
The line items, orders and invoice data can all be consumed in Excel using PowerQuery. Here is a video which shows you how to connect and access the data.
Using the same methodology you can use Microsoft PowerBI to model your data. With PowerBI (or indeed any other BI tool), you can use the Dimension tables to model budget spend as well.
The api call can determine how much data is brought back. If left blank, all of the data will be returned. This could be useful for the very first call. Once you have the core of your data you can then filter down to:
https://data-api.myzahara.net/Export/LineItems?TenancyId=XXX&Year=2022&month=7
or
https://data-api.myzahara.net/Export/LineItems?TenancyId=XXX&year=2022
or
https://data-api.myzahara.net/Export/LineItems?TenancyId=XXX&days=60
Create a new spreadsheet in Excel (Our experience shows that this initial staging needs to be done in Windows Excel. We havent found the functionality in Mac Excel)
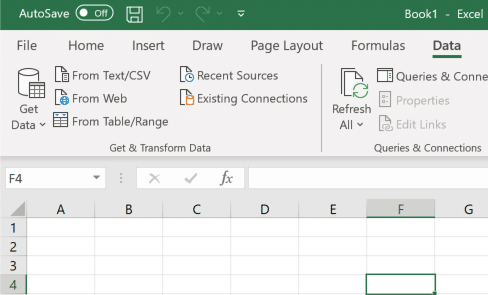
Click on the Data menu, and select From web
Click Advanced to reveal this screen
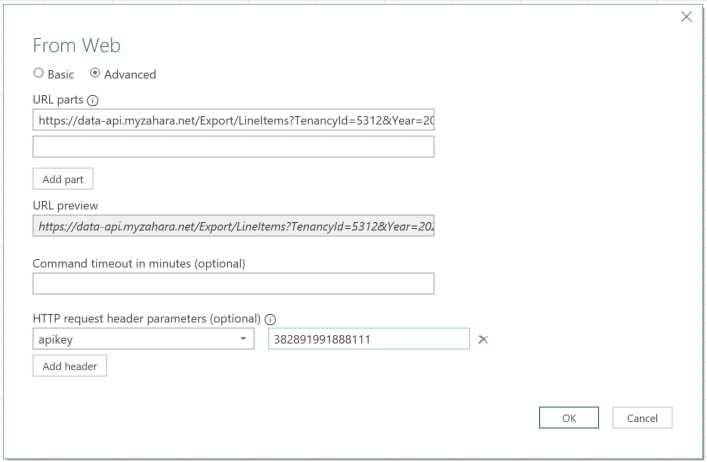
You will now need three elements as we state above:
We will provide you with all of these once we have agreed a trial and pricing plan.
Once you connect up above, you can create a separate tab in Excel per table of data. Excel allows you to transform the data. You can add conditional fields, clean-up dates, and calculated columns such as fixed currency rates.
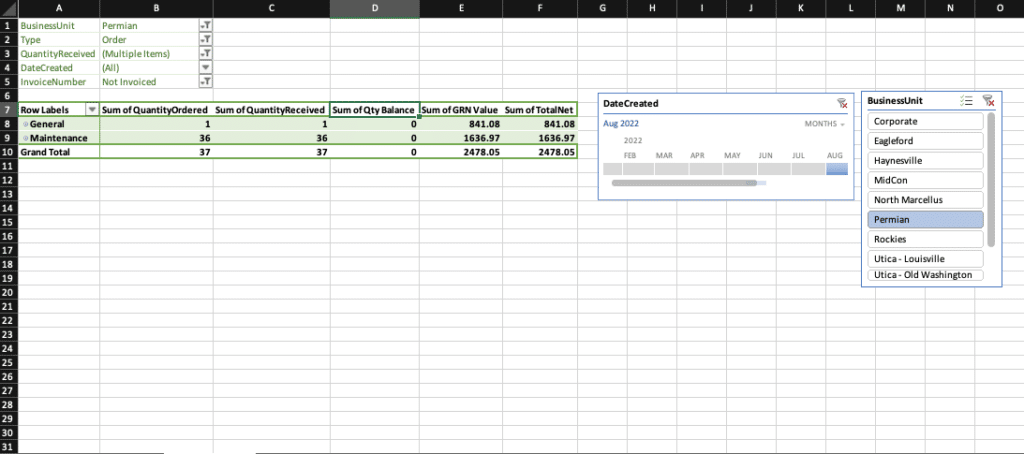
The above is a spreadsheet with a connection to Zahara, using Filters on line-items of purchase orders to show a GRNI value.
To Create a budget report in PowerBI (or similar), you will need to join multiple tables. Typically this will involve:
Below is a screen shot of typical BI project with the data links:
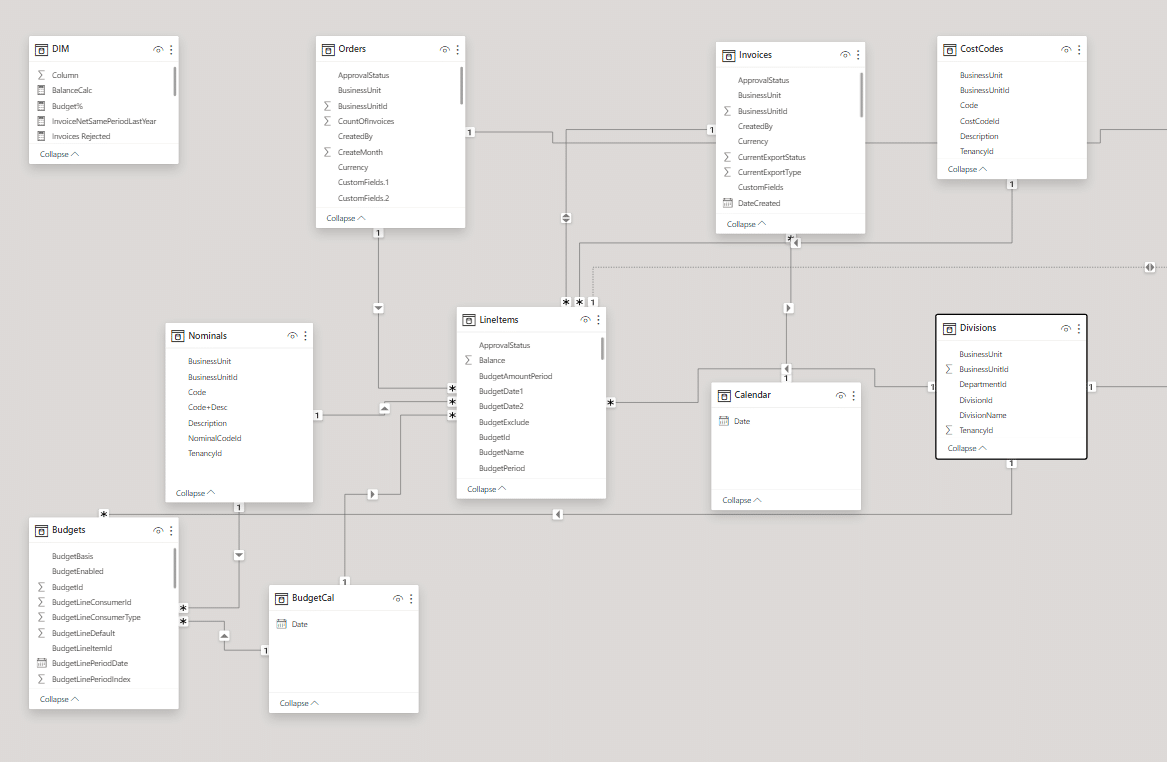
The key budget field is BudgetLineItemID – this should be linked to either NominalCodeID or CostCodeID in the relevant table. Here are our recommended joins:
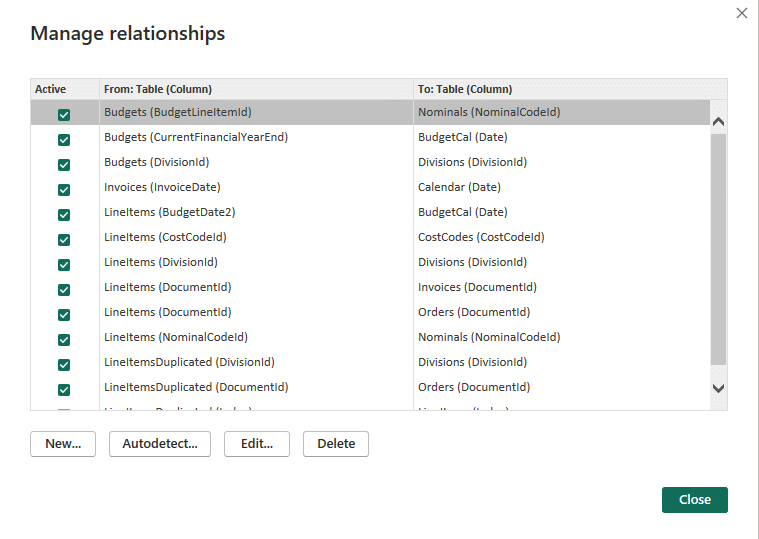
In the above example, we have created a dim table of BudgetCal which is a calendar table. This links to the Budgets.CurrentFinancialYearEnd field (for an annual budget) and then also links to the relevant date field on the LineItems table.
In effect, the Budgets table budgets.LineValue field hold the amount available to spend. We then need a date / period in our report and we need to know how much has been spent by using the line items table (TotalNet or TotalGross) and filtering that accordingly.